Evaluate Queries
Developers often struggle to understand why certain queries fall short of expectations. Without detailed insights, diagnosing issues becomes guesswork, making it harder to identify problems and improve query performance. Our platform lets you experiment with different search options and configurations.
After you send a query, select the query inspector icon next to the Send query button:
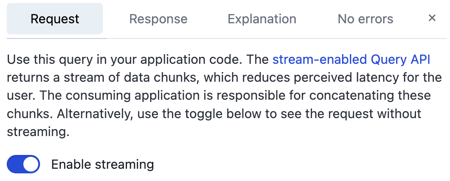
This lets you see the underlying API request, response, and explanation of the query:

View query analysis
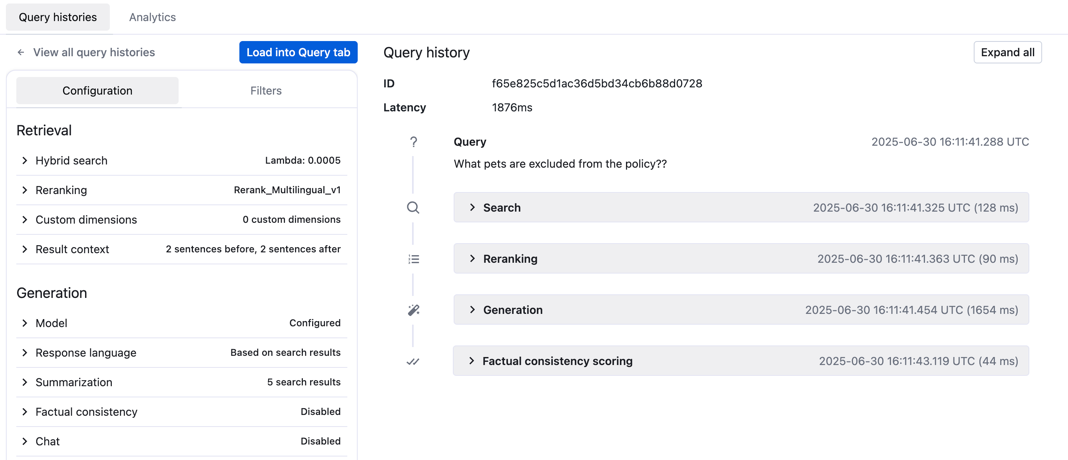
The Explanation tab provides a View query analysis option that provides a detailed breakdown of the execution timeline for a specific query, enabling you to understand how the system processed the query at each stage:

This information is valuable for diagnosing query issues, refining configurations, and optimizing overall performance. The left panel shows the configuration and filters used for the query. The main panel shows each stage with the timestamp and latency:
- Query ID: Specifies the unique identifier for the query
ddc20b2844a0ce2a7dc15d366c4f259d. - Query: Provides the exact time the query was submitted (
2024-12-02 12:58:58.474 UTC), indicating when the search started. - Search: Shows the initial retrieval of relevant data from the corpus.
- Reranking: Refines the order of retrieved results for improved relevance.
- Generation: Produces the final output, including citations and a summary from the LLM.
- Factual consistency scoring: Evaluates the factual accuracy of the generated output against retrieved data.
Click Expand all to reveal detailed information for each execution stage, including specific parameters.
Select Load into Query tab to load this configuration into your query tab so that you can make changes to your settings.