Query observability
As developers build generative AI applications, one of the biggest challenges is understanding why some queries fail to produce the expected results. Diagnosing these issues can be complex, and without clear insights into query execution, users are left guessing about the root cause of problems. This makes it difficult to debug and improve query performance.
Vectara’s query observability provides users with detailed insights into the execution of past queries by offering a comprehensive breakdown of each query’s configuration, response, and execution flow. This enables users to inspect queries at each stage of the query lifecycle which helps diagnose, debug, and optimize their searches.
For more details about query configurations, see Configure Queries.
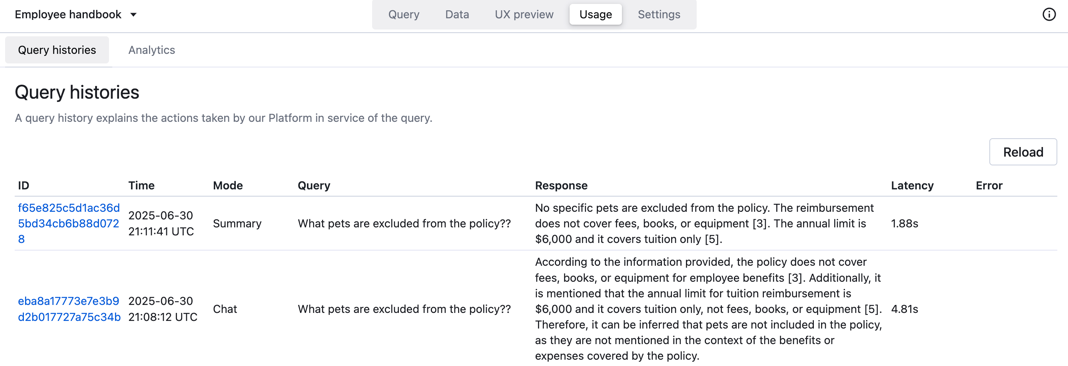
Query histories
A query history explains the actions taken by our platform in service of the query. You view query histories from the Analysis tab after sending a query, or the Usage tab of a specific corpus. The Query histories tab presents a table of previous queries executed against a selected corpus.
Use this table to inspect query details, mark queries for special consideration, and annotate them with comments. The table lists each query ID, the time of the query, the mode (such as Summary), the query text, query response, latency in milliseconds, and any errors.
Performance monitoring capabilities
Query observability provides the following performance tracking:
- Total query latency: Measured in milliseconds for each query
- Component-level latency: Detailed breakdown by pipeline stage:
- Search span latency
- Rerank span latency
- Generation span latency
- Factual consistency score span latency
- Query timestamps: Precise
started_atandcompleted_attimes - Historical trends: Performance analysis over time with the query history API
You can inspect each query by selecting an ID to see how the platform interpreted the query configuration and input, and how the system acted on this input, along with the responses and errors.
Query details
The query details page provides detailed visibility into how our platform processed the query, offering valuable insights for both troubleshooting and optimization. These details include the query text, search results, generated response, and factual consistency score.
For example:
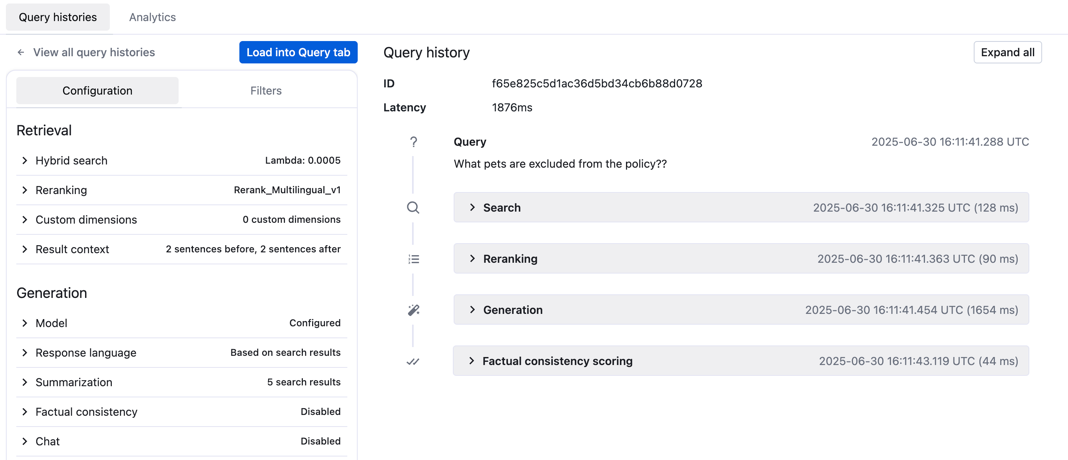
This example query detail shows the following configuration for the query:
- The hybrid search parameters set the lambda value to
0.0005. - Reranking is enabled and using
Rerank_Multilingual_v1. - The query does not use any custom dimensions.
- The result context is 2 sentences before and after.
- The number of search results for summarization is 5.
Click Expand all to reveal detailed information for each execution stage, including specific parameters.
Agent session analytics
For agents, the observability surface is the Sessions tab on the agent detail page rather than the corpus query history described above.
Inspect a session in the console
- Go to Build > Agents and open the agent.
- Select the Sessions tab. Each row is one conversation, with columns for duration, tool call count, and error count at a glance.
- Click a session to open it. The right-edge icons toggle a Debug panel that lists every event in the session:
input_message,tool_input,tool_output, andagent_output. Expand any event to inspect its inputs, outputs, and timing.
Retrieve traces via the API
To pull session traces for aggregation or export to an external dashboard, use the agent analytics endpoint:
GET /v2/agent_analytics/traces
Each trace record corresponds to one session and contains spans for every tool call, step transition, and model turn. Push the results to a tool such as Datadog or BigQuery to build aggregate views across sessions and agents.
The correct path is GET /v2/agent_analytics/traces. The full query parameters and response schema are in the API reference.
Per-query factual consistency score
For direct corpus query calls outside of agent sessions, set enable_factual_consistency_score: true in the generation block to include a grounding score in the response. The score indicates how well the generated summary aligns with the retrieved passages and appears in the query history described in Query details above.